A Glimpse into your ASP.NET App
Diagnosing issues with your web app can be one of the most difficult things for developers. Sometimes, the browser just doesn’t show you what you expect. Visual Studio is the best possible IDE to help developers see what’s going on with their code during development, but what about what’s happening in the ASP.NET framework? And what about after it’s been deployed?
Last year at Tech Ed, I showed off a tool called Glimpse during one of my presentations. As it turned out, one of the creators – Anthony van der Hoorn – was in the audience!
SSW’s Damian Brady recently spoke to Anthony about Glimpse – you can see the video at SSW TV.
Since that interview, the Glimpse team has released a major update with a really awesome new feature – the Heads Up Display (HUD).
When it was turned on, Glimpse used to give you a small icon that you would click on to see all the information. It meant that you had to go looking for problems.

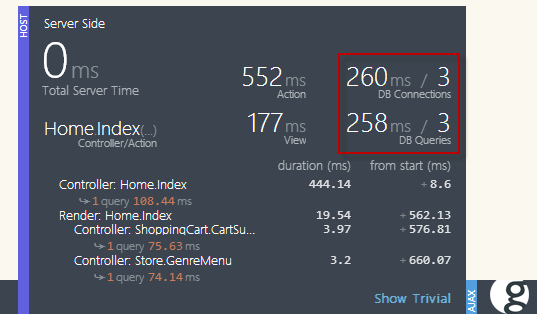
Now, Glimpse gives you a powerful Heads Up Display that you can keep open to show you important statistics without taking up much of the browser real-estate.
If you want to know how many database queries your code ran, all you have to do is glance down (and install the Glimpse.Ado and Glimpse.EF packages of course).

If you want more information, you can hover over a section to drill into it a bit further – again, you don’t need to click anything. It goes away when your mouse moves away.

Of course, you can always click the Glimpse icon to see all the information including the actual SQL queries that were run. With this version it’s been given a nice “Metro” refresh as well.

If you’re not using Glimpse, you should be! Check out our Do You Use Glimpse? rule.
Of course if you’re good and you are using Glimpse on your project, you should upgrade to the latest version to get all the new goodness.
Cheers,
@AdamCogan