
Managing your Azure Costs – How to Avoid Ballooning Budgets
Have you ever had an Azure bill that was a total surprise? I have some awesome war stories, and the most memorable was when our Azure costs skyrocketed 🚀 unexpectedly after someone put a Superpowers poster up in the foyer at SSW. I know what you’re thinking, how on earth did a simple poster on a wall send me a crazy Azure bill? 🤔 Well it wasn’t the poster that was the problem, it was our receptionist… our AI receptionist called SophieHub. It uses Azure facial recognition to welcome people to the office. Sophie kept recognizing the faces on the poster as a person and sending it off to Azure 24/7. Ouch.
Once you’ve had a bill shock, you’ll start looking at ways to stop it from happening again in the future. Even better, if you are proactive, you’ll never encounter bill shock.
Azure Monitoring
Recently, SSW TV released an Azure cost video from Warwick Leahy – it is so important to set up alerts so you are informed when you hit budget limits. That’s step 1, but you should be using some other tools and tricks where you never get a nasty bill from Microsoft.
We’ve written a handy Rule to help you get started with this: ssw.com.au/rules/azure-budgets/
Azure Cost Analysis 💰
Azure Cost Analysis is a fantastic tool for determining where the larger $ costs are coming from. This analysis lets you quickly identify the big-ticket items to reduce your bill.
When it comes to Azure expenses, you want to be informed and monitor your costs. You can also have a solution that not only helps you understand where the spending is coming from but also helps you find ways to optimize it. With Azure Cost Analysis, you can confidently provide your Product Owners with insights and recommendations that will save time and money, and make everyone’s day a little brighter ✨
When looking at your cost, it’s best to take a look at your top 3 spenders first. By the time you get down to the 4th one you’ve hit the law of diminishing returns, and the effort will outweigh the savings, unless your cost is really enormous.
Always tackle the biggest 3 costs first. In most instances they will be upwards of 98% of your spend, particularly if you are in a wasteful environment. I have seen MANY projects where the largest cost by a significant margin was Application Insights.
Bryden Oliver, Azure expert
Azure Cost Analysis gives you a detailed breakdown of where any Azure spending is coming from. It breaks down your cost by:
- Scoped Area e.g. a subscription
- Resource Group e.g. Northwind.Website
- Location e.g. Australia East
- Service Type e.g. Azure App Service
Note: You can also ‘filter by’ any of these things to give you a narrowed-down view
Analyzing the expenditure – Finding the big dogs 🐶
To optimize spending, analyze major costs in each category. Generally, it’s a good idea to focus on the top 3 contributors – optimizing beyond that is usually not worth the effort.
Key questions to ask:
- Do you need that resource?
- Can you scale down?
- Can you refactor your application to consume less?
- Can you change the type of service or consumption model?
Scoped Area ⚡
The cumulative costs show a selected area over a given time period, e.g. the cost of a subscription charted over the last year, showing the period of higher or sudden growth during that time. You can clearly see the cost went up in August and remained high.

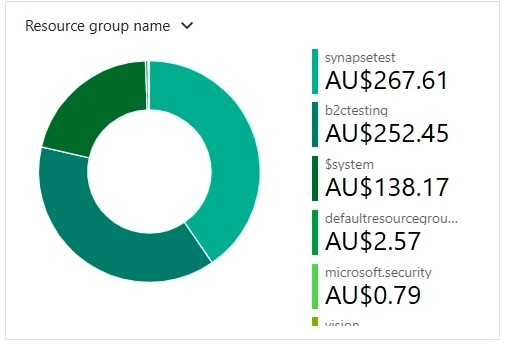
Resource Group💲
This is where you can see the cost of each resource group in the scoped area, e.g the cost of the Northwind website infrastructure.
Ignore the tiny ones, you should look at the most expensive Resource Group and try to reduce it.
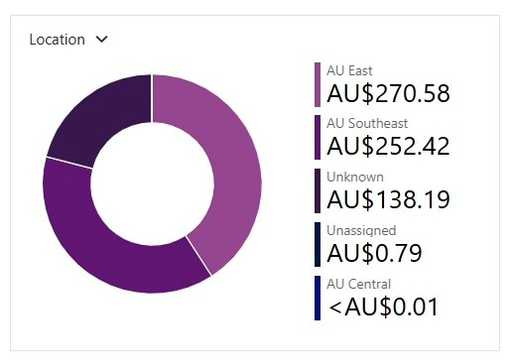
Location 🌏
This breaks down what region the resources are deployed in, and shows you the cost of each location e.g. Australia East.
If you have your applications spread across multiple locations, this chart can help figure out if one of those locations is costing more than others. Consider scaling each location to the scale of usage in that location ⚖️.
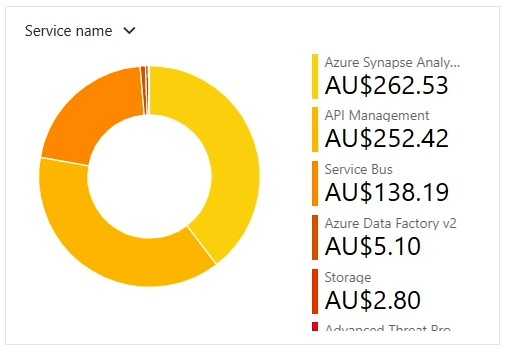
Service Type 🌩️
This will show you which of your Azure Services is costing you the most money, e.g. Azure App Service.
If a specific service is costing a lot of money, you can consider if there is a service that might be better suited, or if that service can have its consumption model adapted to better fit the usage levels.
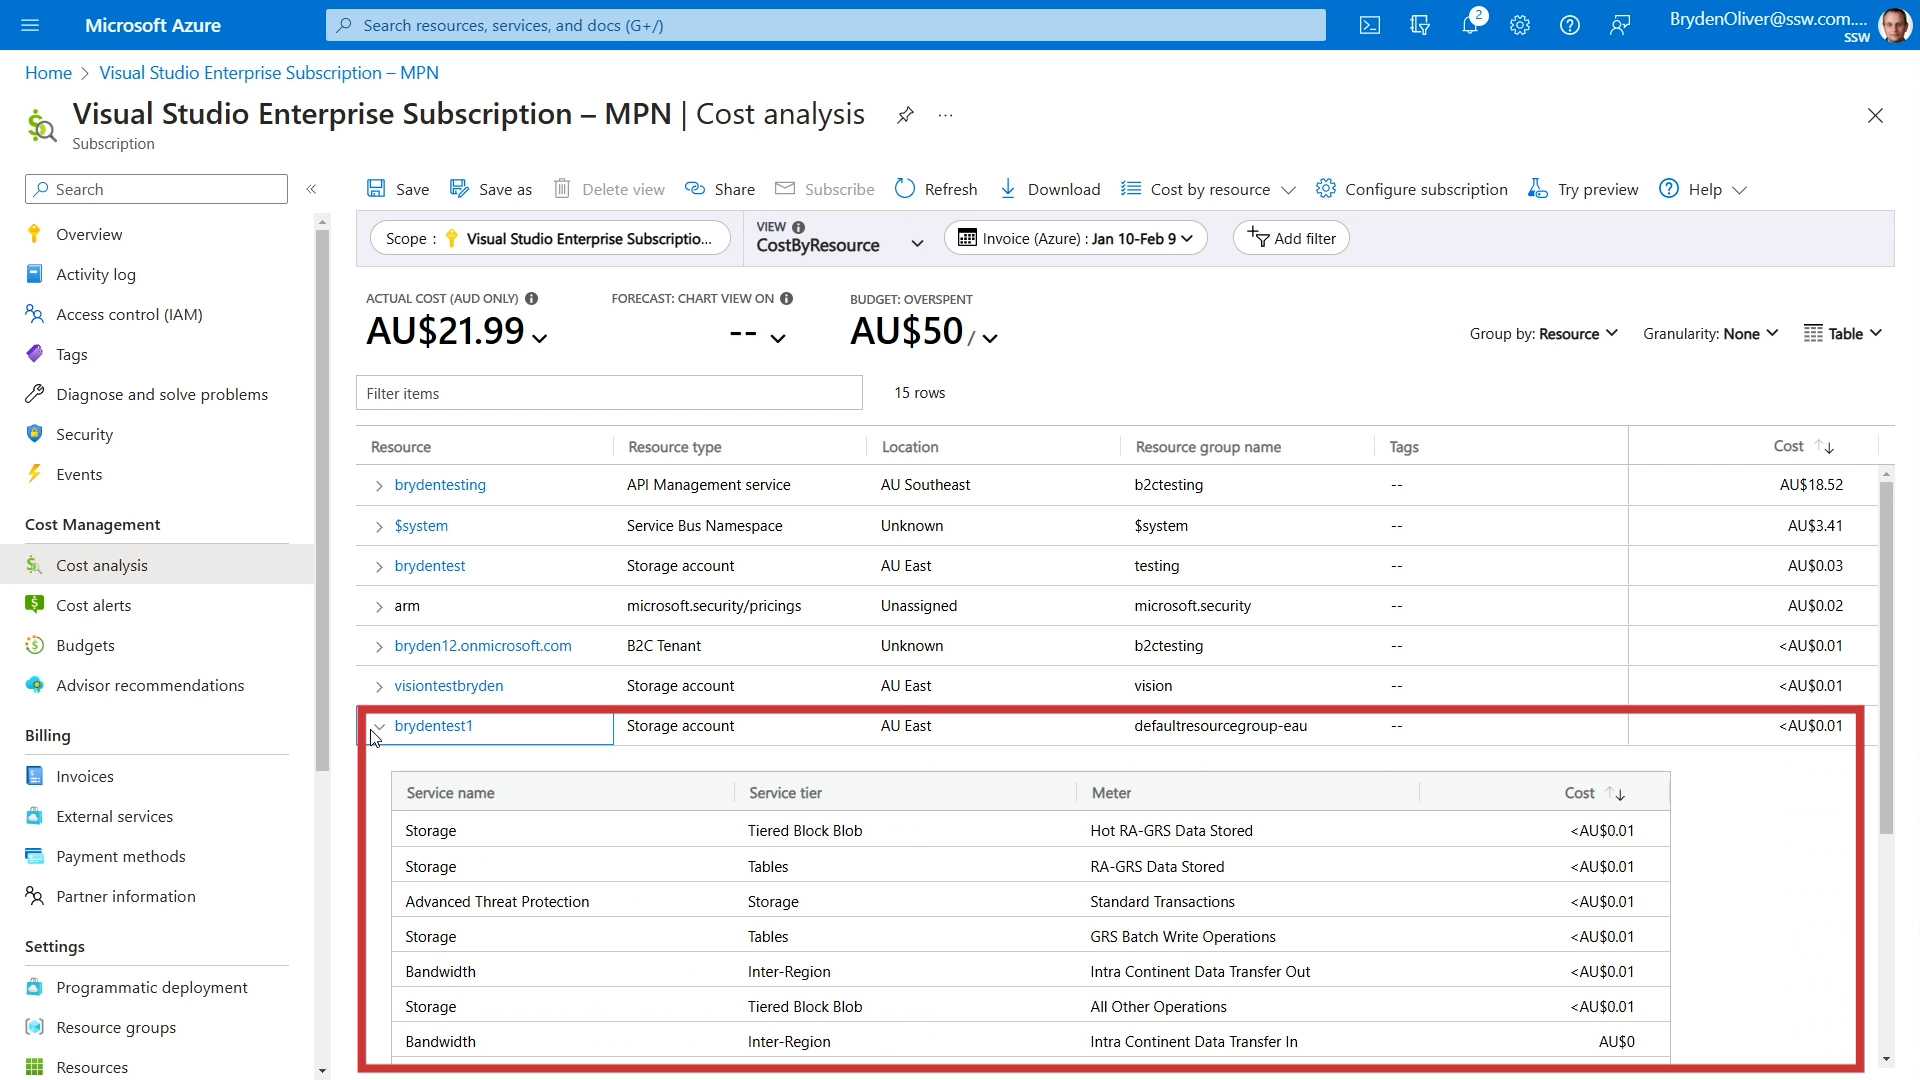
What if you suspect a specific resource is a problem? 🕵🏻
The Azure Cost Analysis tool also allows for different views to be selected. One of the most useful filters you can use to see if a specific resource is causing a problem, is the “CostByResource” view. You can view each aspect of a resource that is costing money. That way you can identify an area that can be improved 🎯. Often clients say things like:
‘My storage is costing me a fortune, but I’m not actually using a lot of storage’.
If you check the “CostByResource’ it’s often something like the bandwidth, or the operations, which is all of the reads and writes. They cost you money too, not just the storage itself.
Those are the most important tips, but there’s more on Rules to Better Azure. Do you have any tips that I missed? Let me know in the comments!
March 30, 2023 @ 1:36 AM
Why would anyone fall for this Azure stuff in the first place? I don’t get it.