TFS is huge in China – the work item journey with 20 million records (Part II)
Update: Lei Xu has also posted this in Chinese.
Let’s continue the story of a hair raising project. Nothing is small in China! Read Part I here.
We’ve looked at the people factors, and now let’s look at the technical part.
Lesson 3: Tune your SQL indexes – back to basics
TIP: Read SSW Rules to Better SQL Server Databases
Using the right indexes is one of the most basic concepts when performance tuning SQL Server. Everybody knows you cannot touch the TFS SQL database directly, so they incorrectly assume that they can’t performance tune the indexes.
Before making any changes we measured the execution time 3 times to get an average.
We tested with a load of 100 concurrent users, plus 1 user setup with a collector to do the measuring.
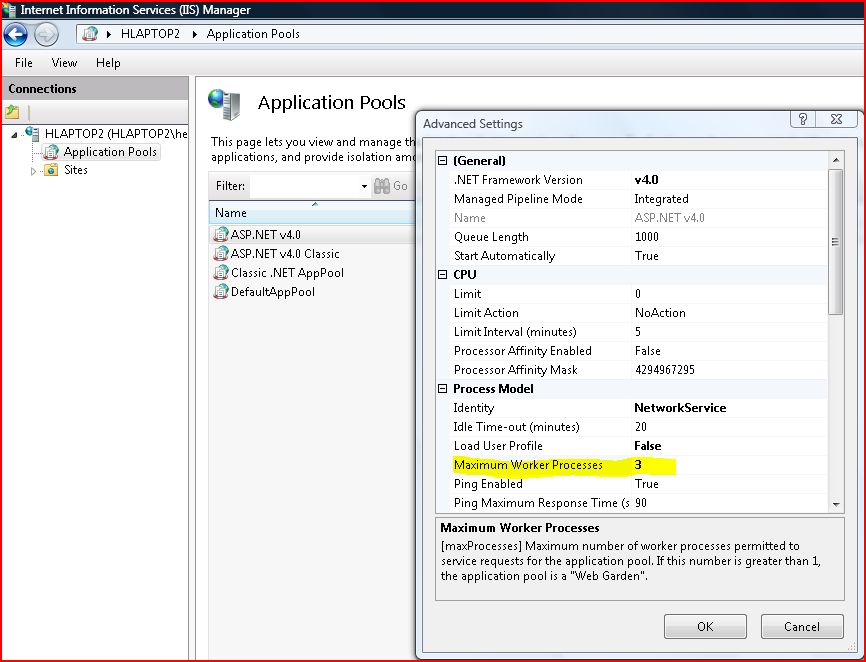
We set the IIS setting for ‘Maximum Worker Processes’ (see yellow highlighting on image below) to “7”. (Use the calculation in Lesson 6 below)
There were 2 custom fields that the users were searching often. After adding the 2 indexes, the performance improved about 3 times.
| IIS setting ‘Maximum Worker Processes’ |
Concurrent Users | Test 1 (s) | Test 2 (s) | Test 3 (s) | Average(s) |
| TFS field index = off | |||||
| 7 | 101 | 14.2 | 11.0 | 10.1 | 11.8 |
| TFS field index = on | |||||
| 7 | 101 | 3.95 | 3.9 | 4.2 | 4.0 |
| Improvement 292% | |||||
Figure: The performance improvement by enabling TFS field indexes was huge
More information:
We enabled a field index by executing the following command:
witadmin indexfield /collection:CollectionURL /n:Name /index:on|off
Refer to http://msdn.microsoft.com/en-us/library/dd236909.aspx for more details about the witadmin command.
Lesson 4: Avoid virtualization in an *extremely* demanding production system
Hyper-V is very useful for optimizing your server infrastructure, however we’ve learnt you should avoid using Hyper-V on the data tier, because the Disk I/O overhead it introduced affected our performance significantly.
In this project, the 1st step we did to boost the performance was to optimize the data by moving the data tier to dedicated hardware that exceeded the recommended system requirements for maximizing SQL performance. The gain we got was roughly double.
Refer to http://msdn.microsoft.com/en-us/library/ms143506%28v=sql.105%29.aspx
Note: We first tested Hyper-V Pass-through disks prior to deciding that dedicated hardware was substantially better. That said, Pass-through disks performed better than VHDs (fixed or dynamic), but were still not good enough.
Lesson 5: Put your SQL log file on a separate disk
We then moved the SQL data/log/temp files to 3 separate physical disks. This is an old one but a good one. This helps because SQL Server is very I/O intensive.
Refer to Top 10 steps to optimize data access in SQL Server: Part V
Lesson 6: Enable the Web Garden in IIS8 (or IIS7) – maxProcesses is the magic setting
Warning: This configuration change is not recommended in 99% of cases as per http://blogs.iis.net/chrisad/archive/2006/07/14/1342059.aspx . We must have been in the 1 % (our scenario matched the description by Chris Adams) so we gave it a shot and it worked.
One of clients requirements was for one of their large busy systems, to call TFS and create work items. The 2 systems needed to stay in sync.
IIS by default has limited number of concurrent requests it can handle, the rest are put in a queue. Many long running transactions mean many things in the queue.
“Web gardens was designed for one *single* reason – Offering applications that are not CPU-bound but execute long running requests the ability to scale and not use up all threads available in the worker process.”
Why is the TFS application different from most web applications?
We are not sure why it falls into the 1%, but my understanding is TFS uses a dynamic data schema (Under the covers, they have a long, narrow table that stores dynamic column values as rows that then need to be pivoted to create a short and wide dataset), which makes the SQL queries very expensive, especially when you customize your process template a lot, e.g. adding many custom fields like we did.
There are another 2 conditions you need to meet before you enable the Web Garden:
- You are not using any InProcess sessions
- Your service is totally stateless (this is usually the same as 1, but not always)
Fortunately, the TFS WebApp meets these conditions. And this is why we can use NLB (Network Local Balancing) on the AT (Application Tier) of TFS without any extra configuration.
The last question is, how many processes should I allow?
This is a tricky question and I wish we could give you a simple answer. In our tests, we found it depends on many factors, such as physical hardware, the application and even the request patterns. As a general rule, you should never set it above the number of CPU cores that you have on your box. This is because the overhead of switching between CPU cores kills any performance gains.
Therefore our IIS AppPool configuration was set at maxProcesses = (number of cores) – 1… in our case that equalled “7” (as we had 8 cores)
Lesson 7: In your integration code, find the performance bottleneck using Visual Studio Profiling (on the client side)
Note: we have a rule about measuring performance: Do you avoid reviewing performance without metrics?
You may notice until now, we haven’t really touched the application yet, either the TFS WebApp or the application we developed.
The general rule when you are trying to improve performance is to focus on what gives the best ROI.
In this case, tuning indexes can improve an application sometimes more than 10x, but you cannot buy 10x hardware. So you should always tune your index first, then hardware and the last thing you want to touch is your code.
We used the Visual Studio Performance Wizard to analyse our code. It allowed us to identify the bottleneck quickly…
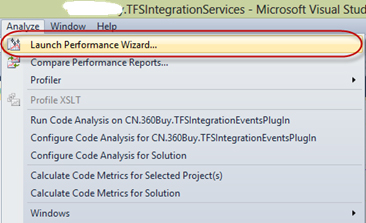
Here is the 1st report we saw:
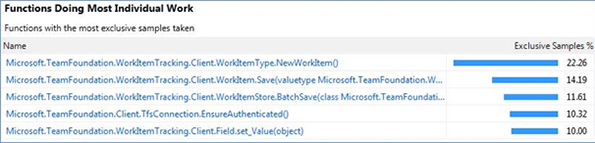
You can clearly see the most expensive call in the chart is NewWorkItem(), so we dug into this method and found out it it’s actually the object initialization that costs the most. However, we cannot optimize this object initialization because that’s a core object. So we decided to implement an object pool to cache enough pre-initialized objects when the program starts, so then it’s just consuming it from the pool. Once the code was changed, this reduced the time by 22%.
More details: http://msdn.microsoft.com/en-us/library/ms751482.aspx
Lesson 8: In your integration code, find the most expensive Web Service calls to the server (enable TFS tracing)
In lesson 6, we measured the TFS Object Model APIs, but we still needed more optimizations. So we dug deeper and found the most expensive calls to the server.
We enabled tracing on the client side and generated the following log.
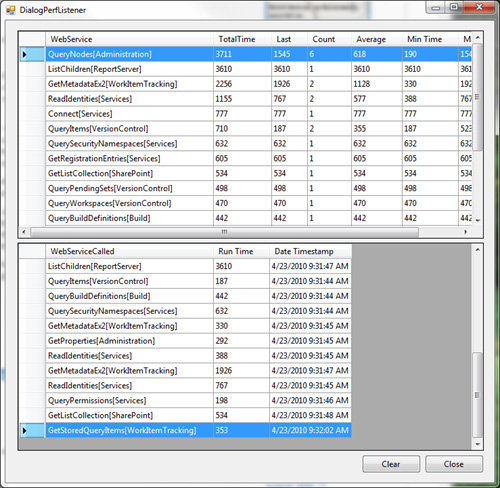
We found out the most expensive Web Service offender was GetMetadataEx2(WorkItemTracking) which is related to NewWorkItem() method, and this proved some of our suspicions before (in lesson 7). The TFS Client Object Model is reliant on some local cache to store the work item schema information, so it doesn’t have to retrieve this information every time. This confirmed our object pooling solution (in lesson 7) as a way to great benefits.
More info: the configuration to enable this tracing is below:
<system.diagnostics>
<switches>
<add name="TeamFoundationSoapProxy" value="4" />
</switches>
<trace autoflush="true" indentsize="3">
<listeners>
<add name="perfListener" type="Microsoft.TeamFoundation.Client.PerfTraceListener,Microsoft.TeamFoundation.Client, Version=10.0.0.0, Culture=neutral, PublicKeyToken=b03f5f7f11d50a3a"/>
</listeners>
</trace>
</system.diagnostics>
Figure: Configuration to enable tracing on TFS
More details on client side tracing: http://blogs.msdn.com/b/buckh/archive/2010/04/23/how-to-see-the-tfs-server-calls-made-by-the-client.aspx
More details on server side tracking: http://blogs.msdn.com/b/edhintz/archive/2007/03/30/tfs-client-tracing.aspx
We then tested these options:
- Object pooling on the TFS Object Model API (as per lesson 7)
- Directly invoke the TFS Web Service endpoint
And they got similar improvements. After some debate, we chose Object Pooling as it was the safer choice since it is based on the documented API.
Summary
So in the end TFS holds up well under a massive load. The success of this project depended on going through a logical process of divide and conquer. We confirmed that the maximum benefit, for the least cost was still Index Tuning. But in very large systems there is much for you can do to squeeze out significant performance improvements. All in all, I am very proud of the results and I can say the project was a success, the client was happy and our SSW team learned heaps.
(the end)
Cheers,
@AdamCogan
TFS is huge in China - the work item journey with 20 million records (Part I) - Adam Cogan's Blog
August 4, 2013 @ 5:38 AM
[…] Read part II here. […]
TFS 在中国 (第二部分) | ALM Networks Lei Xu
August 4, 2013 @ 5:39 AM
[…] 更新:Adam Cogan 发布了本篇博客的英文版。 […]
July 22, 2015 @ 6:39 PM
I have read your articles with great interest! Can you elaborate on how you determined which custom fields needed to be indexed? Did you use DMV’s?
Thank you,
Janet Conklin